
Advanced Grower Solution’s production reporting package uses Microsoft Power BI platform to report and track sales to customers, product margins, current product availability, projected product availability, sales plan vs actuals and sales credits. The reporting package can connect, process and model data from multiple disparate data sources – Sage X3 ERP System, standalone databases, manual excel files, etc. and, present streamlined automated Sales Reports organization wide.
Sales Plan vs Actual
Copyright Advanced Grower Solutions
Report Highlights:
- Sales Report – This report page summarizes actual sales in units and dollars across the selected time window. The data can be sliced through different customers and their categories, shipping facilities, customer product categories, and SKUs. Key metrics on the report – Total Shipped Units and Dollars, Total Invoiced Units and Dollars, Product Margins.
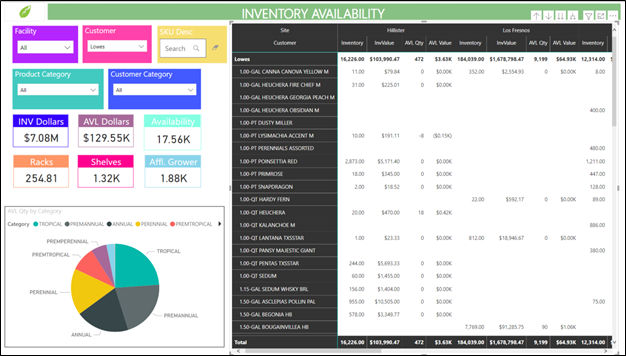
- Current Inventory Availability – This report page presents current inventory availability by taking into consideration current ready to sell on hand inventory and allocation to open customer orders. The data can be sliced through different product categories and customers. Key metrics on this report page are – Available Units at cost and selling price.
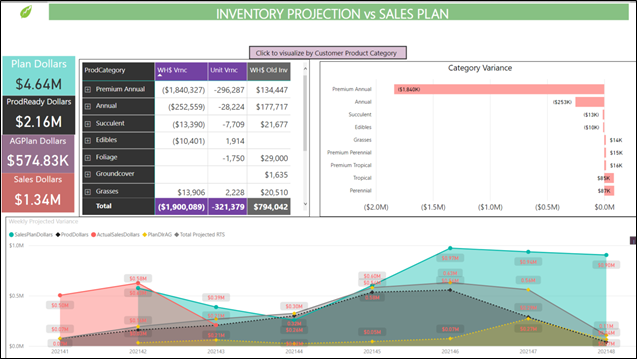
- Projected Inventory Availability – This report page summarizes and compares a weekly projected inventory availability by taking into consideration projected ready to sale date of current on hand inventory, future sales plan and last year actual sales for the same time period. The data can be sliced through different product categories and customers. Key metrics on this report page are – Weekly Projected Inventory vs Sales Plan – Overages/Shortages at Customer Sales Price, Old Inventory On Hand at Customer Sales Price.
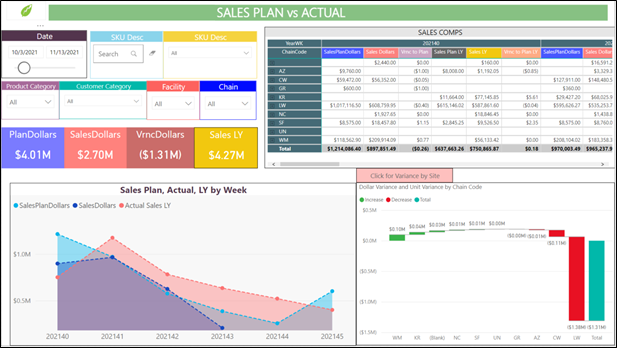
- Sales Plan vs Actual – This report page summarizes and compares actual sales vs sales plan at weekly level for current year and, same period last year. The data can be sliced through different customer and their categories, manufacturing/shipping facility and product categories. Comparative metrics on this report page are – Actual Sales Dollars vs Plan Dollars – This Year vs Last Year, Actual Sales Units vs Plan Units – This Year vs Last Year, Plan Fulfillment Rate – This Year vs Last Year.
- Sales Credits – This report page summarizes sales credits issued to customers at weekly level categorized with different credit reason code like – product quality, discounts, billing errors, etc. The data can be sliced through different customer and their categories, manufacturing/shipping facility and product categories. Key metrics on this report page are – Sales Credits Dollars Issued, Total Credit Percent to Sales.
- Sales Plan – This report presents Sales Plan for a selected time period in a very simple tabular form and high-level sales plan overview dashboard. Key Metrics on this report page are – Total Sales Plan Dollars, Total Projected Cost of Goods Sold for the Sales Plan, Total Gross Margin for the Sales Plan, Product Line Margins, Sales Plan Line Details.
Report Snippets:
Sales Plan vs Actual
Copyright Advanced Grower Solutions
Inventory Availability
Copyright Advanced Grower Solutions
Projected Availability
Copyright Advanced Grower Solutions
*All the above report definitions and snippets come along with the basic Production Report package that can be integrated with ERP database. Customizations can be accommodated based on the specific needs. The report package comes with predesigned mobile views that can be rendered on the Power BI mobile app.
Free Initial Consultation
Complete the contact form below to schedule a free consultation to learn more about how Advanced Grower Solutions can help you build end to end business analytics.